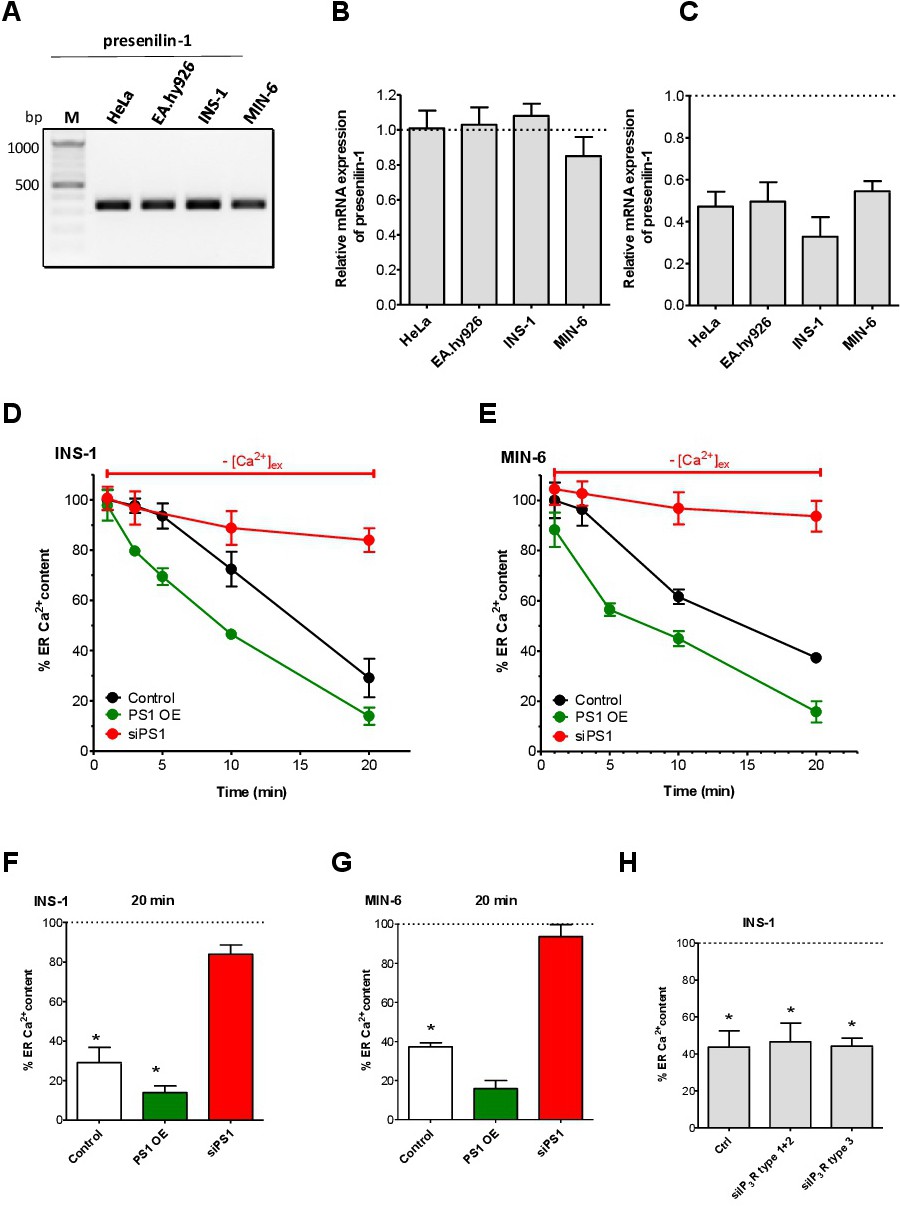
Fig. 5. Enhanced ER Ca2+ loss in β-cells is due to presenilin-1. (A) Representative gel showing detection of mRNA levels of presenilin-1 in HeLa, EA.hy926, INS-1 and MIN-6 cells via standard PCR using gene and species specific primers (n = 3). (B) Quantification of mRNA expression levels of presenilin-1 in HeLa, EA.hy926, INS-1 and MIN-6 cells compared to mRNA levels of the housekeeping gene GAPDH detected with qPCR (n = 3). Bar charts indicate mean + SEM. (C) Quantification of knockdown efficiency of presenilin-1 in HeLa, EA.hy926, INS-1 and MIN-6 cells compared to the housekeeping gene GAPDH using real-time PCR (n = 3). (D,E) Evaluation of the influence of presenilin-1 knockdown (siPS1) and over-expression (PS1 OE) on ER Ca2+ leakage - depicted as percentage of the initial ER Ca2+ content in (D) INS-1 and (E) MIN-6 under control conditions (black lines), upon knockdown of presenilin-1 (red lines) or over-expression of presenilin-1 (green lines) after incubation under Ca2+-free conditions. ER Ca2+ stores were depleted at the indicated time by treating the cells with 15 µM of the SERCA inhibitor BHQ and 100 µM carbachol. Points represent the mean values ± SEM (n ≥ 6). (F) Corresponding statistics for panels D and E showing the % of ER Ca2+ content in INS-cells (upper panel) and MIN-6 cells (lower panel) after 20 min incubation in Ca2+-free buffer and after ER Ca2+ stores were depleted by 100 µM Cch and 15 µM BHQ. Respective 1 min values were set to 100%. Bars represent mean ± SEM (n ≥ 6). *p<0.05 versus respective 1 min control or as indicated in the graph using one-way ANOVA. (G) Percentage of ER Ca2+ content in INS-1 cells after 20 min of incubation under Ca2+-free conditions either under control conditions or after knockdown of the indicated types of IP3R. ER stores were depleted after 20 min by applying 0.2 µM of ionomycin together with the SERCA inhibitor BHQ (15 µM). In each graph the 1 min control value was set to 100% (n ≥ 5). *p<0.05 versus respective 1 min control or as indicated in the graph using one-way ANOVA. (H) Percentage of ER Ca2+ content in INS-1 cells after 20 min of incubation under Ca2+-free conditions either under control conditions or after knockdown of the indicated types of IP3R. ER stores were depleted after 20 min by applying 0.2 µM of ionomycin together with the SERCA inhibitor BHQ (15 µM). In each graph the 1 min control value was set to 100% (n ≥ 5). *p<0.05 versus respective 1 min control or as indicated in the graph using one-way ANOVA.